OS Mapping and Topology
Using the AR Sandbox to understand Maps and the impact of Landscape
Intended for senior school classes studying geography, looking at use of maps and relating them to landscape.
Using the hills and valleys you make in the sand, the model can show what happens when it ‘rains’ – where the water goes and how it flows until it gathers in a marsh area, pond, sea or lake. This is used as a way to demonstrate topography, Watershed and Catchment areas, allowing changes in shape or volume to be seen in action.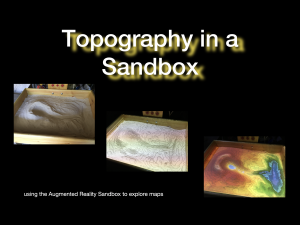
The Slides and Notes here give a suggested use of the sandbox as a project/lesson plan together with some ‘student notes’. It is an outline and is intended only to give a concept of use rather than a strict programme of work!.
Objectives
Students learn about topography and contours using both printed maps and the hands-on Augmented Reality Sandbox. They learn to relate a printed map to landscape and understand contours, using the Sandbox as an aid or illustration.
They will learn about the impact of landscape, and the effect on and by human activity..
The notes are an outline lesson plan, and the slides are intended to provide the guidance for students.
A shorter version for Year 4/5 students is available.
The Slide Pack
The PowerPoint slide show to introduce the lesson/project and the aims of the tasks.
It is created in Microsoft Powerpoint - it may not translate to other slideshow tools (eg Keynote or Libre Office) without a bit of tweaking.
Download the slidepack here.
Lesson Plan
The guidance and notes for the Lesson in this download file provide some notes, and outline tasks list for the students.